

Issue No. 62

The year is 1961. John F. Kennedy’s Secretary of Defense is a numbers guy called Robert McNamara. A former accounting professor who crunched numbers for the Army Air Forces during WWII, then joined Ford as one of the “Whiz Kids.” There, he rose through the ranks to president and ran the business on the principle that you can manage anything if you measure it. Now in government, he brings that same objective, evidence-based approach to the job.
Enter Vietnam, where over the next few years, the US becomes entrenched in an intractable war in which it’s unclear who’s winning and who isn’t. McNamara does what comes naturally to him and relies on metrics like “enemy body count” and “kill ratios.” And by the logic of those metrics, he reasons, as long as the US’s casualties are lower than the other side’s, then the US is winning.
When Edward Lansdale, a counterinsurgency expert, tells McNamara that the feelings of Vietnamese people toward their government, the war, and each other are missing from his list of metrics, McNamara reportedly writes “x-factor” on the list in pencil, then erases it, reasoning that something that can’t be measured doesn’t belong in the analysis.1
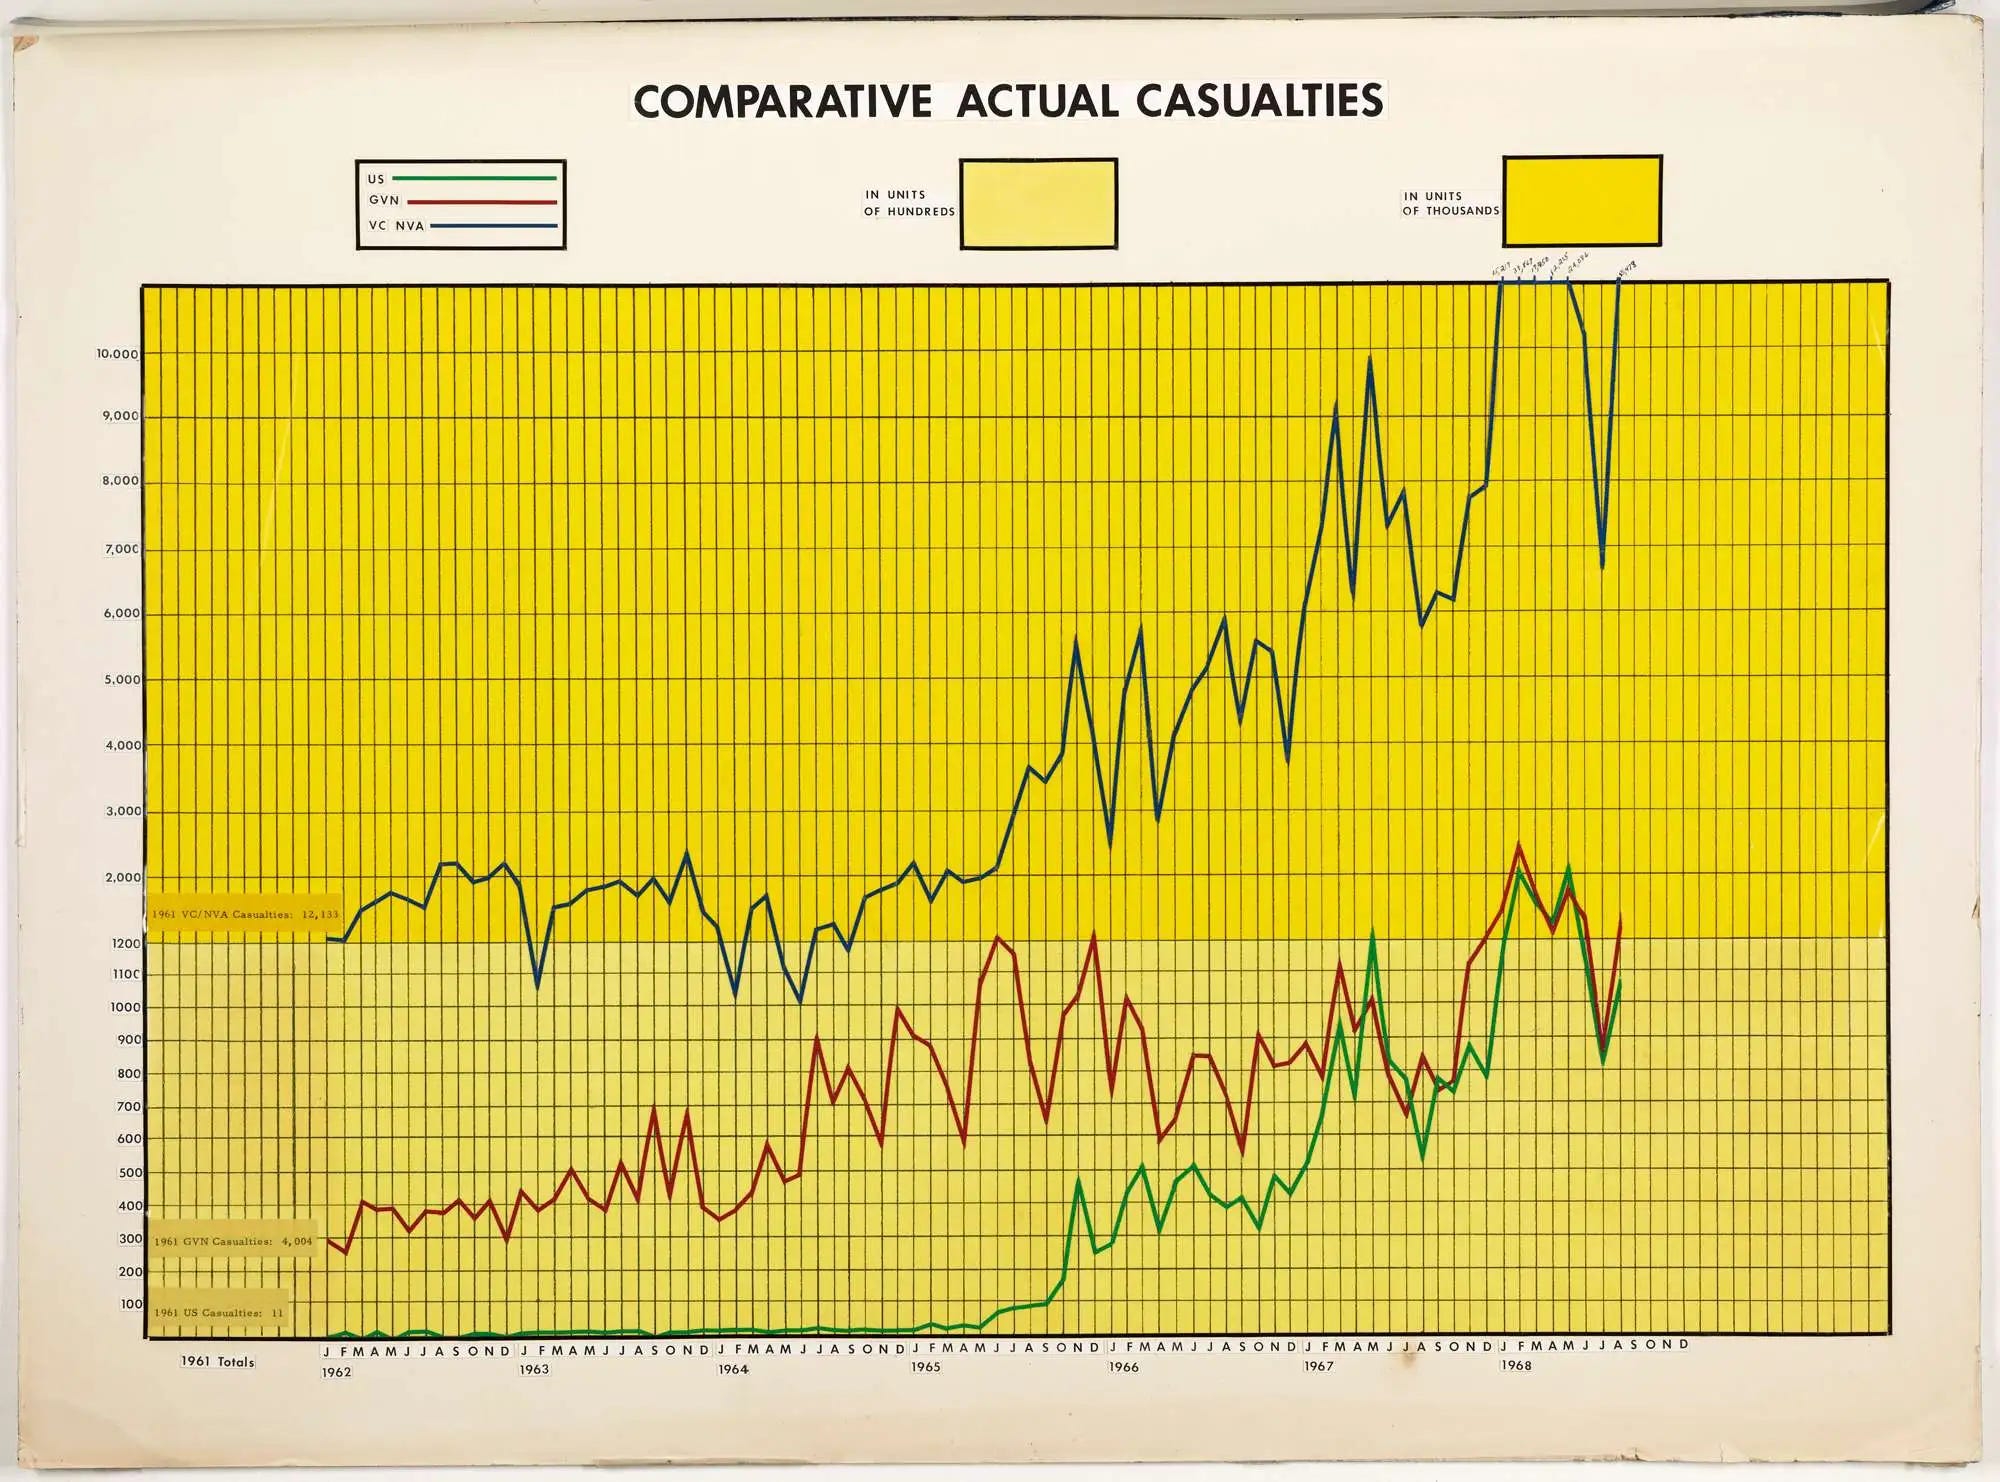
Beyond McNamara’s charts and metrics, reality tells a different story. The US isn’t in fact winning. And enemy body count doesn’t account for the other side’s determination and resolve, not to mention the multitude of factors that inform a quality like that. McNamara eventually concedes in his memoir about three decades later that the war was a mistake.
Here’s a story closer to home. I once worked on a product, and every quarter, we’d have a town hall for the entire org where someone would get up on stage and present top-line metrics showing, without fail, that the product had gotten better compared to the previous quarter.
If mean-prompt-to-response-time used to be, say, 0.8 seconds, it was now 0.76 seconds, and surely that was a good thing. The metrics were objective, they were evidence-based, and they almost certainly came from a good place.
But the product never actually felt any better to the people using it. All one had to do was walk up to a random person on the street and ask them what their experience with it was like to realize that was the case. They’d tell you they never quite trusted it to do what they asked. The feeling of trust for the average person using that product was just not there.
If we were to distill those two stories into a common pattern, it might look like this. When faced with an ambiguous problem, like Are we winning a war of attrition? or Is our product any good?, we:
Measure whatever can be easily measured.
Disregard what can’t easily be measured or given a quantitative value.
Presume that what can’t be measured easily isn’t important.
Conclude that what can’t be measured doesn’t exist.
That pattern in fact comes from sociologist Daniel Yankelovich who called it the McNamara Fallacy in his 1971 talk. It captures what many of us who actually want to do the right thing and use data to inform our decisions end up doing.
The fallacy is: If you’re confronted by a complex problem that is full of intangibles, you decide to measure only those aspects of the problem that lend themselves to easy quantification, either because you find the other aspects difficult to measure or because you assume that they can’t be very important or don’t even exist.
—Daniel Yankelovich (Sales Management, 1971-11-15: Vol 107, Issue 11)2
For those of us doing the thinking (coming up with metrics, say), we end up with blind spots because our proxy for tracking reality is not as representative as it ought to be. We find comfort in what can be easily measured and eventually assume it’s the only thing worth measuring.
And for those of us processing someone else’s thinking (reading a chart, say), we end up with blind spots because we mistake someone else’s quantitative, annotated, evidence-based figure for reality. It’s the illusion of precision, which is to say, precision sometimes fools us into thinking we’re looking at the whole picture when in fact we’re not, or put differently, that what’s true of the sliver is true of the whole.
Where else do we see that fallacy?
At work. When we base performance solely on lines of code written or AI tokens spent for software engineers, or on number of procedures completed for doctors, or on billable hours for lawyers, or on arrests made or tickets issued for police officers.
At school. When we base a student’s potential for higher learning largely on their test scores rather than on their curiosity and love of learning.
With our health. When our health tracker tells us our oxygen saturation looks great, or that we hit our step goal for the day, but doesn’t (or can’t) tell us how we’re doing mentally or whether we’re pushing ourselves toward burnout or injury.
With charts. When we get caught up in improving a chart’s readability by pointing out that, say, the y-axis of a bar chart ought to start at zero, or that lines use a certain curve function, or that colors meet a certain contrast ratio. All worthwhile, but what’s worth asking too is what we aren’t charting that we should be.
What’s the takeaway?
We can try flipping each of those four steps in the pattern into a question, and seeing where that gets us.
Measure the hard things. Are there things that aren’t easy to measure that we ought to measure?
Account for the unquantifiable. Are we ignoring things we can’t easily quantify, like feelings?
Don’t confuse hard with unimportant. Are we assuming that difficulty to measure is the same thing as not important?
Remember what’s off the chart. Are we assuming that because we don’t see something, because we’ve chosen not to measure it, that it doesn’t exist?

I don't want to be a prisoner of comfort.
—Alberto Giacometti
Until next time.
Be well,
Ali
P.S. Some past issues to read through in case you missed them.



The Road Not Taken: Edward Lansdale and the American Tragedy in Vietnam by Max Boot
https://archive.org/details/sim_sales-management_1971-11-15_107_11/page/26/mode/2up
Where I’ve worked these were called “vanity” metrics. Figures that definitely look good, and feel good to talk about in front of a big room- but didn’t really mean much in the grand scheme of anything, or anybody. I will often counter a vanity metric by asking something to the tune of “…and so what?” - hopefully to uncover the thing we’re actually trying to get to.
I don't think I've ever seen an explanation that so pithily skewers (sorry; unintentional) the so-called "business model" as applied to education or virtually anything else.